I think most people can’t tell you what they did last Tuesday. I’m afraid I can tell you what I did on most Tuesdays since June 3rd, 2014. Every hour, every project, every break, every meeting, every late-night rabbit hole.
I have about 44,000 rows in a spreadsheet where each one is a block of time — when it started, when it ended, what I was doing, and a short note. Over eleven years and mostly no gaps.
I realize I haven’t talked about this habit often. When I did, I guess my friends thought I was crazy. And they are probably right: I know exactly how crazy — 44,000 rows of crazy.
Here’s what I think those rows taught me.
![]()
The spreadsheet started with a nagging feeling
Back in 2014, I was running a software company (Plastic SCM, a version control system — later acquired by Unity Technologies).
I was a big fan of software estimation back in the day, so I wanted to have a full database of project estimations and their actual times, so we could compare. As soon as you have data, you can say “this new project will take as much as this other one” and you have quite accurate numbers for best case, worst case, and most likely case (all about this in the great book “Software Estimation: Demystifying the Black Art”).
But I had this persistent feeling that I wasn’t accomplishing enough. The “number of hours per task” wasn’t telling me what I could improve. I suspected interruptions were eating me alive, or maybe it was lack of focus, but I couldn’t prove it. So on June 3rd, I opened a spreadsheet and started logging: start time, end time, what I was doing, and a short note.
I wanted to move away from just sensations and into real data.
The data was shocking. I’d think “I worked on that feature almost all day, at least six hours” — only to find 3.5 hours, split into several chunks. The interruptions were real, and now I could see them, but I also spotted meetings, planning, and many “other” unnamed things that could take a good chunk of the day.
I started making decisions and changes: too much time on meetings, too little time in marketing, less time coding than I actually expected… and adjusted accordingly.
What 44,000 rows actually looks like
Each row has five fields:
- Start time
- End time
- Type (work, personal, health, learning, etc.)
- Subtype (the specific project or activity)
- Notes (what I actually did)
That’s it. No mood scores, habit checkboxes, or gamification. Just: what did I do, and for how long?
Probably the simplicity was the point. Anything more complicated and I would’ve quit in month three.
The things I learned
You don’t spend time as you think
This was the very first lesson. I’d finish a day thinking “I spent at least six hours on that feature.” The rows said 3.5, split across several chunks with meetings and interruptions in between.
It happens every time. In my most productive periods, I average about 6 hours of real, focused work per day. If you asked me to guess without the data, I’d have said 8-9 hours easy.
In 2018, I was CTO of Plastic SCM, but as a founder you jump into whatever is needed. If you’d asked me what I spent most of my time on, I’d have said “marketing and product.” The data told a different story:
| Category | Hours | % of work time |
|---|---|---|
| Marketing | 290h | 15.4% |
| Planning | 172h | 9.1% |
| Dev tasks | 148h | 7.9% |
| Support | 134h | 7.1% |
| Analysis | 126h | 6.7% |
| Dev meetings | 108h | 5.7% |
| Documentation | 90h | 4.8% |
| Unproductive | 81h | 4.3% |
| Product | 69h | 3.7% |
| Travel | 62h | 3.3% |
| Training | 62h | 3.3% |
| 60h | 3.2% | |
| HR | 51h | 2.7% |
| Everything else | ~230h | ~12% |
Marketing — the thing I considered key — barely got a sixth of my hours. Meanwhile, 81 hours went to “unproductive,” 60 to email, and 51 to HR. Running a company is death by a thousand small tasks, and you don’t see it until you measure it.
This kind of data also helped us make bigger decisions. Around 2017, after years of Scrum, some key team members and I were spending too much time in planning. Seeing it in the numbers helped us look for alternatives, and we moved to full Kanban — cutting our cycle time in half.
Fewer entries = better day
The best days are the ones with the fewest entries. Fewer entries means bigger chunks of uninterrupted work. Days where I bounced between four different things have lots of short entries and fewer total productive hours. Days where I did one or two things have a few long blocks and way more output.
My most productive weeks are monotonous. One big project, deep focus, long blocks. My least productive weeks look “busy” — lots of variety, lots of switching. The row count tells you which kind of day it was before you even read the notes.
The diary is the unexpected gift
I started tracking time to understand where it went. The diary came free, quite naturally.
Because every row has a note — even a short one — I accidentally created a searchable record of my life. I can look up any day and remember what I was working on, what I was struggling with, what I was excited about. I started just with work-related stuff, but a few months later I was taking personal notes too, even thoughts and feelings. Going back and reading how you felt when you took a decision years ago is quite therapeutic — you took that decision because of something, and 4 years later you just remember the good things, not the bad ones.
A spreadsheet isn’t a journal, but 44,000 annotated moments, stacked one on top of another, turns out to be something real close.
Why I built it into a product
For over a decade, my “app” was a spreadsheet — first Excel on Windows, then Excel on macOS, and eventually Google Sheets. It worked but it wasn’t really enjoyable. I squeezed stats out of pivot tables, which got the job done but wasn’t exactly elegant. No way to print a yearly diary. No way to spot patterns without manually wrangling pivots every time I had a question.
So I built rows.life — the tool I wished I’d had from day one. It’s a time tracker that’s also a journal. You log rows (just like my spreadsheet), and it turns them into statistics, insights, and a printable diary.
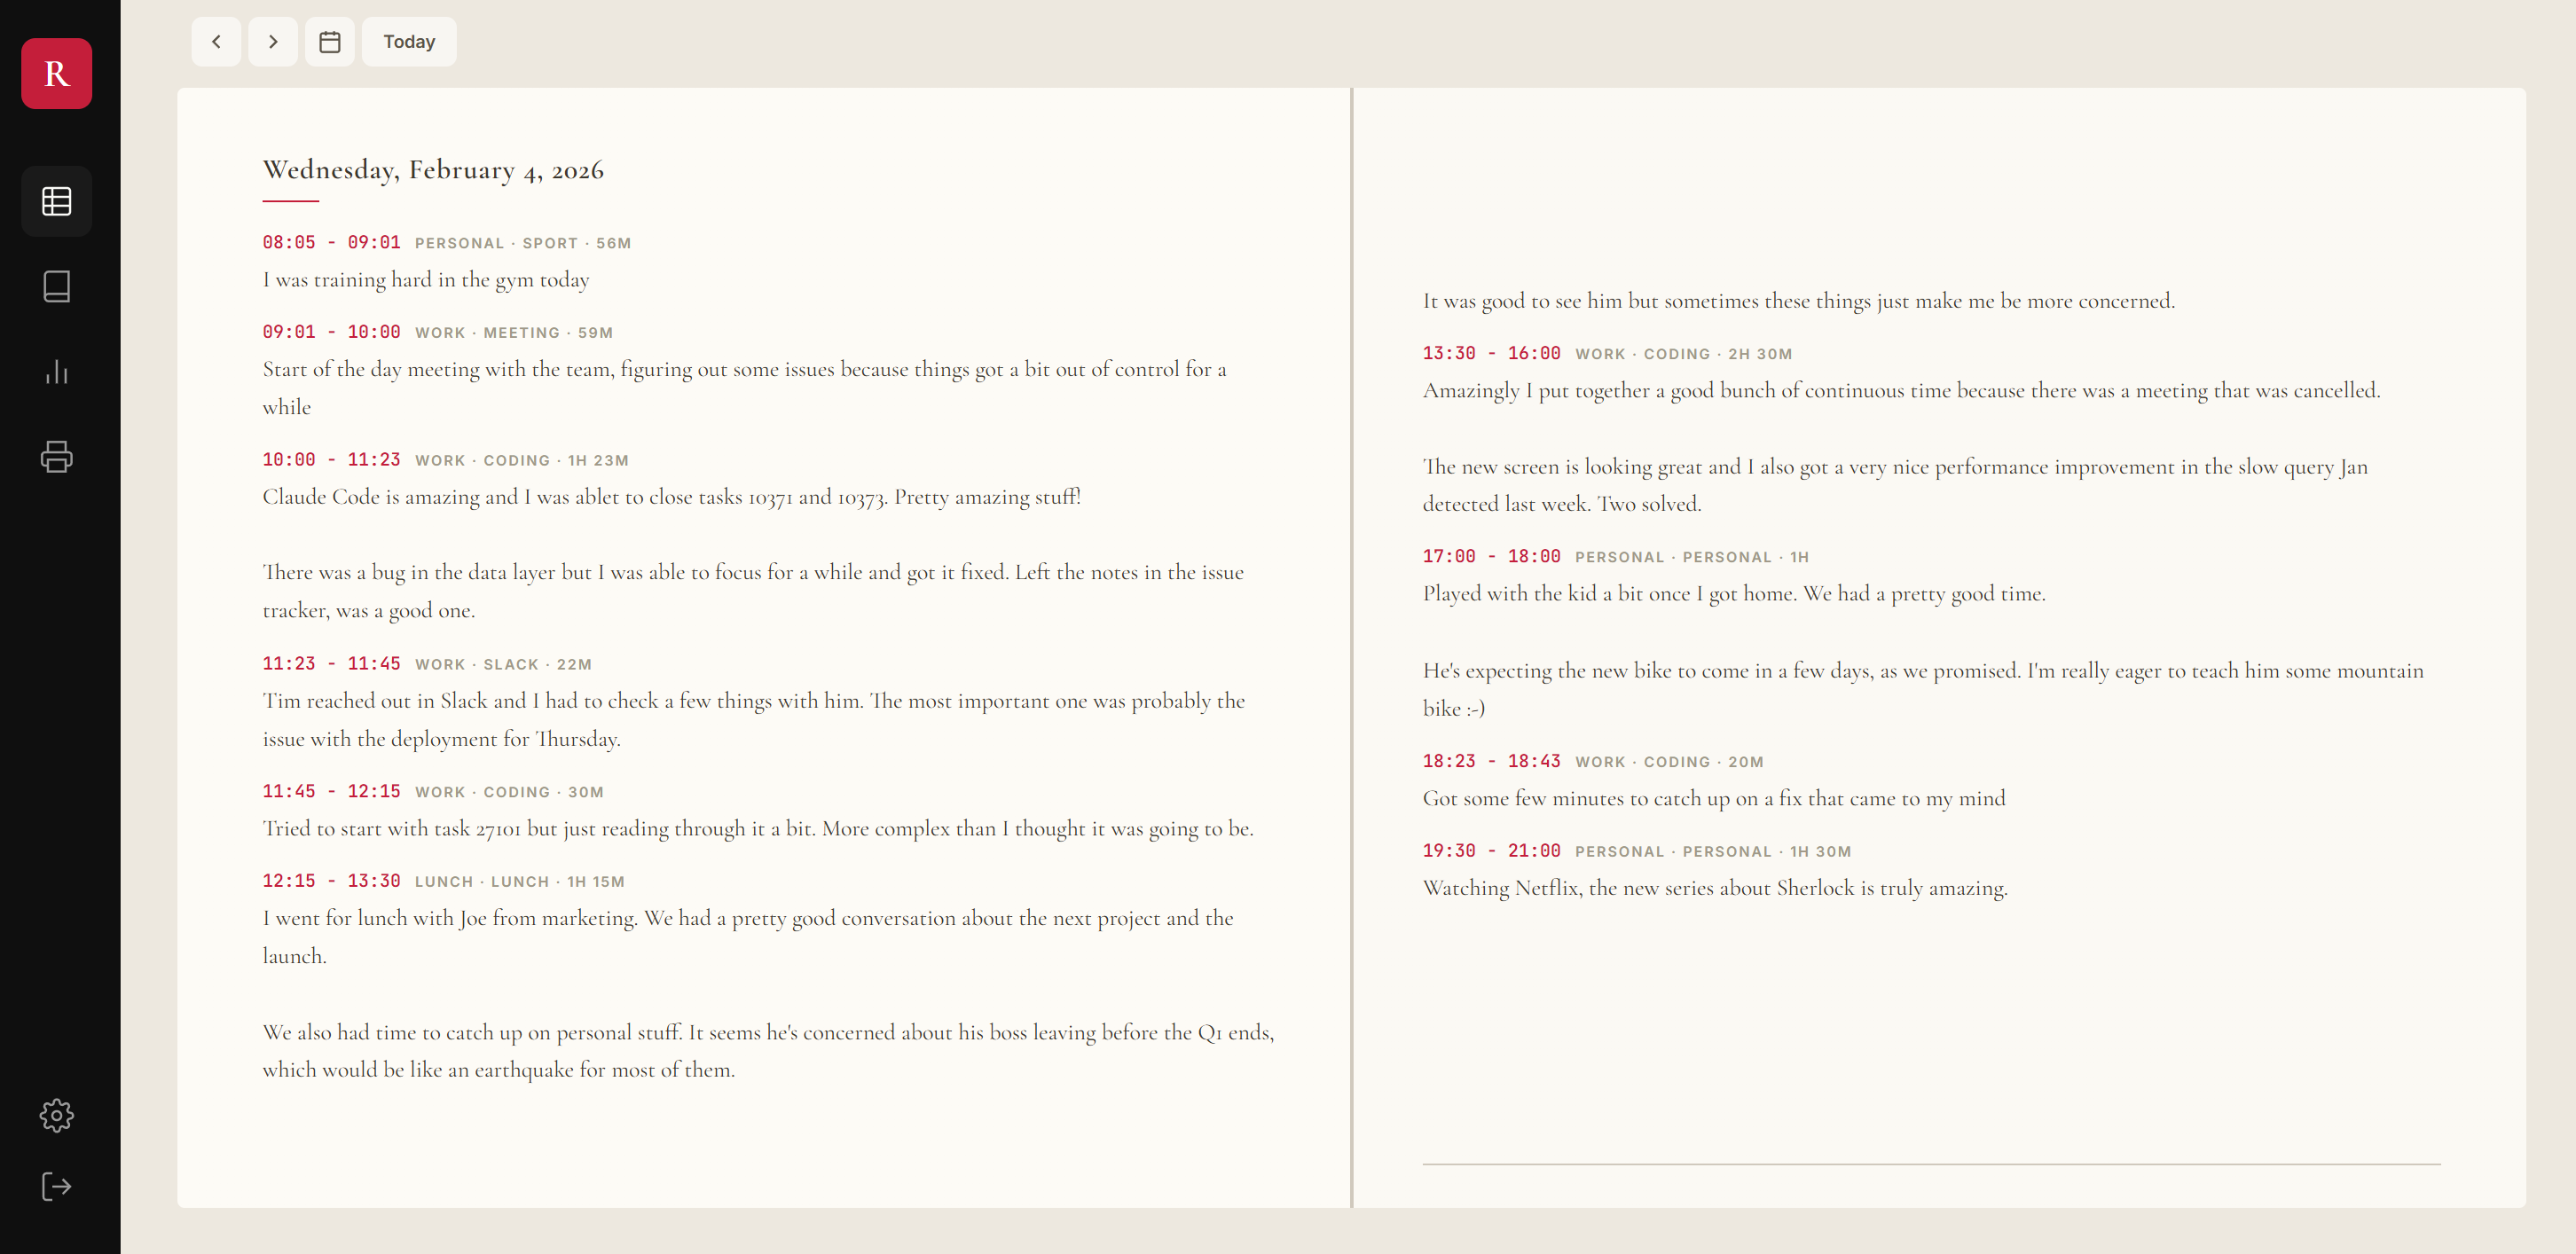
The diary view — each day reads like a journal, which is what I always wanted from my spreadsheet
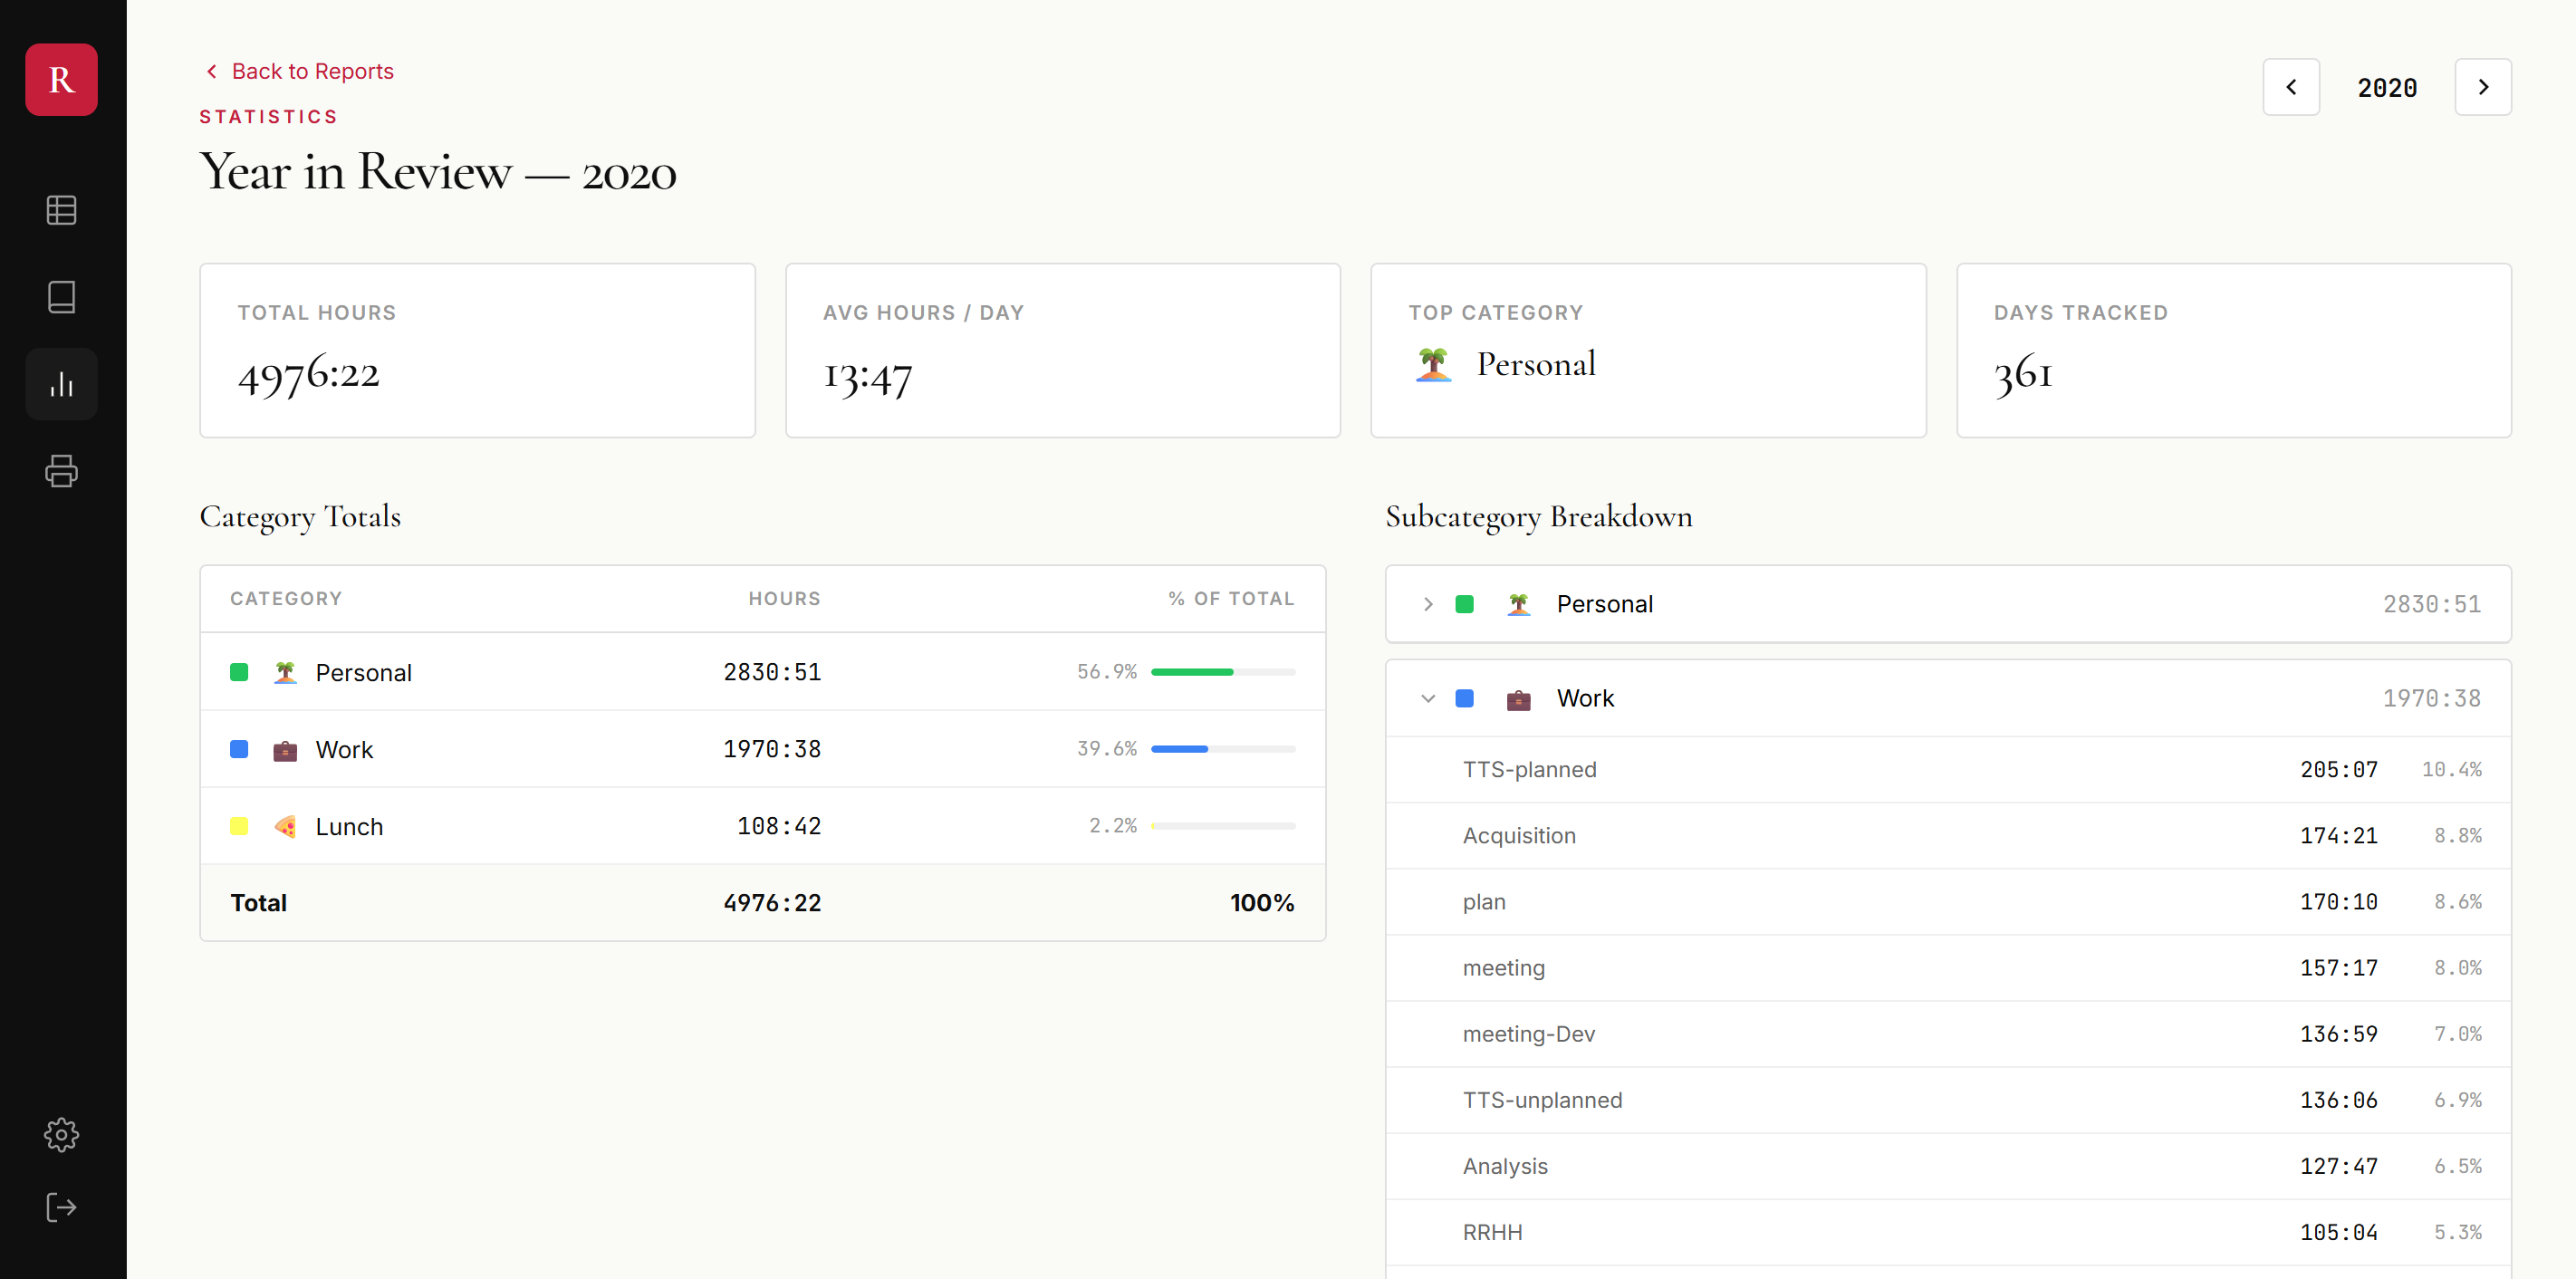
Year in review — the kind of breakdown I used to wrestle out of pivot tables
It has zero-knowledge encryption (your notes are encrypted in your browser before they leave your device), full data export (your data is yours), and the analytics I spent years wishing my spreadsheet could do.
I’m not going to pretend that everyone needs this. Most people don’t want to log every hour. That’s fine. But if you’re reading this and thinking “I already do something like that” or “I’ve always wanted to try” — this is for you.
Bonus: maybe I was always going to end up here
If I’m honest, this didn’t really start in 2014. My first computer was an Amstrad PCW 8256, and one of the first things I built on it was a program to track my bicycle rides. Distance, time, routes — a kind of Strava, except it was 1990-something, there was no internet, no GPS, no automatic syncing. Just me, typing data into a machine after every ride. I even sold a few copies through a magazine ad.
Around the same time, I remember watching Doogie Howser type his diary into his computer at the end of every episode. That image stuck with me — the idea that you could close each day by recording what it meant. Doogie was basically blogging before blogs existed.
I later spent my career building version control systems — tools that track every change in source code. Looking back, there’s a thread: version control tracks changes in code, rows.life tracks changes in life. I’ve apparently always needed to measure things. Maybe it’s just how my brain works.
rows.life — Track your time. Remember your life.